NIRS-EEG lab: Difference between revisions
Jump to navigation
Jump to search
No edit summary |
No edit summary |
||
| Line 71: | Line 71: | ||
* plot single channels, all channels, or topographic distribution (for a specified time interval) | * plot single channels, all channels, or topographic distribution (for a specified time interval) | ||
[[File:Refa64.png|left|thumb|Refa64]] | |||
[[File: | |||
[[File:Mobita32.png|left|thumb|Mobita32]] | |||
Revision as of 10:42, 2 July 2015
PAGE UNDER CONSTRUCTION
Biophysics NIRS-EEG Lab - General information
- If you wanna book the NIRS-EEG Lab, please use Google Calendar.
- Please, take notes in the lab journal about experiments that have been run
- Use protocols for your study/experiments/pilots
Technical facilities
TDT
- 1 RZ6
- 1 RP2
- 2 RA16 (medusa)
EEG
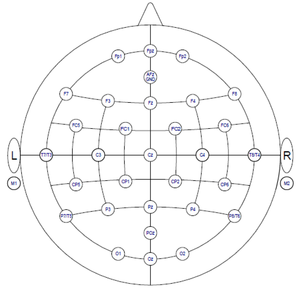
- 32 channel water-based electrode system (TMSI, Mobita), including headcap(s)
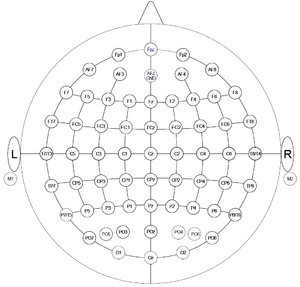
- 72 channel REFA, including headcaps in 3 different sizes (TMSI)
- 16 channel REFA (TMSI)
- ring electrodes including separate caps for combined measurements with NIRS
- TMSI Polybench recording software
NIRS
- 2 x 24 channel system (Oxymon, Artinis) each consisting of 8 transmitters and 4 receivers (splitted fibers)
- sampling rate up to 250 Hz
- 8 AD channels (according to Artinis, they only sample at the rate of all other channels. Care needs to be taken, if sampling at low rates. Present your triggers for longer durations then)
- Oxysoft recording software
Prepared NIRS experiments
- Basic finger tapping experiment (blocked)
- Mapping experiments (blocked)
- Auditory oddball experiment (tones, event-related)
Basic NIRS analysis
Besides Marc's scripts for all steps during NIRS data analysis, you can start using the fieldtrip toolbox http://www.fieldtriptoolbox.org/development/nirs. Here is a general pipeline of what you may wanna do with your NIRS data.
- read raw data (.oxy3) recorded with the oxymon
- read trigger information from AD channels
- define your trial (pre- and poststimulus interval, event code)
- apply a filter
- segment continuous data into trials (epoching)
- convert data, i.e. changes in optical density to concentration changes
- average data per condition/event
- perform baseline correction
- plot single channels or a whole grid
- More things to do/program: do a reference channel subtraction, plot a topomap
Prepared EEG experiments
- Frequency oddball
- Spatial oddball
Acquired data using the Polybench Software (TMSI) can be read into Matlab using tms_read(Filename.Poly5) provided by TMSI. Further analysis could for example be run with Fieldtrip (http://www.fieldtriptoolbox.org) or EEGLab (http://sccn.ucsd.edu/eeglab/).
- reformat raw data structure to be compatible with the output of fieldtrip preprocessing
- readout trigger/event information from the trigger channel
- define your trial (pre- and poststimulus interval, event code)
- segment continuous data into trials (epoching)
- detect and remove artifacts
- filtering
- average data per condition/event
- correct baseline
- prepare channel layout once depending on the used electrode cap (for correct plotting)
- plot single channels, all channels, or topographic distribution (for a specified time interval)

